
Profiling
Defold includes profiling tools integrated with the engine and build pipeline. They help find performance, memory, and resource-usage problems. Runtime profiling data can be consumed by several facilities:
- The basic profiler and in-game visual profiler are available on all platforms.
- The Remotery profiler and interactive web frame profiler are available on desktop and mobile platforms.
- HTML5 builds can publish Defold scopes to the browser’s Web Performance API.
The Profiler setting in the App Manifest controls whether profiler code is linked into a build. Debug Only is the default, None excludes it, and Always includes it in both debug and release builds. The profiler settings in game.project control runtime behavior but do not link excluded profiler code back into a build. In particular, Track CPU controls CPU usage sampling; it is separate from the App Manifest choice.
The runtime visual profiler
Builds that include profiler support feature a runtime visual profiler that displays live information overlaid on the running application:
function on_reload(self)
    -- Toggle the visual profiler on hot reload.
    profiler.enable_ui(true)
end
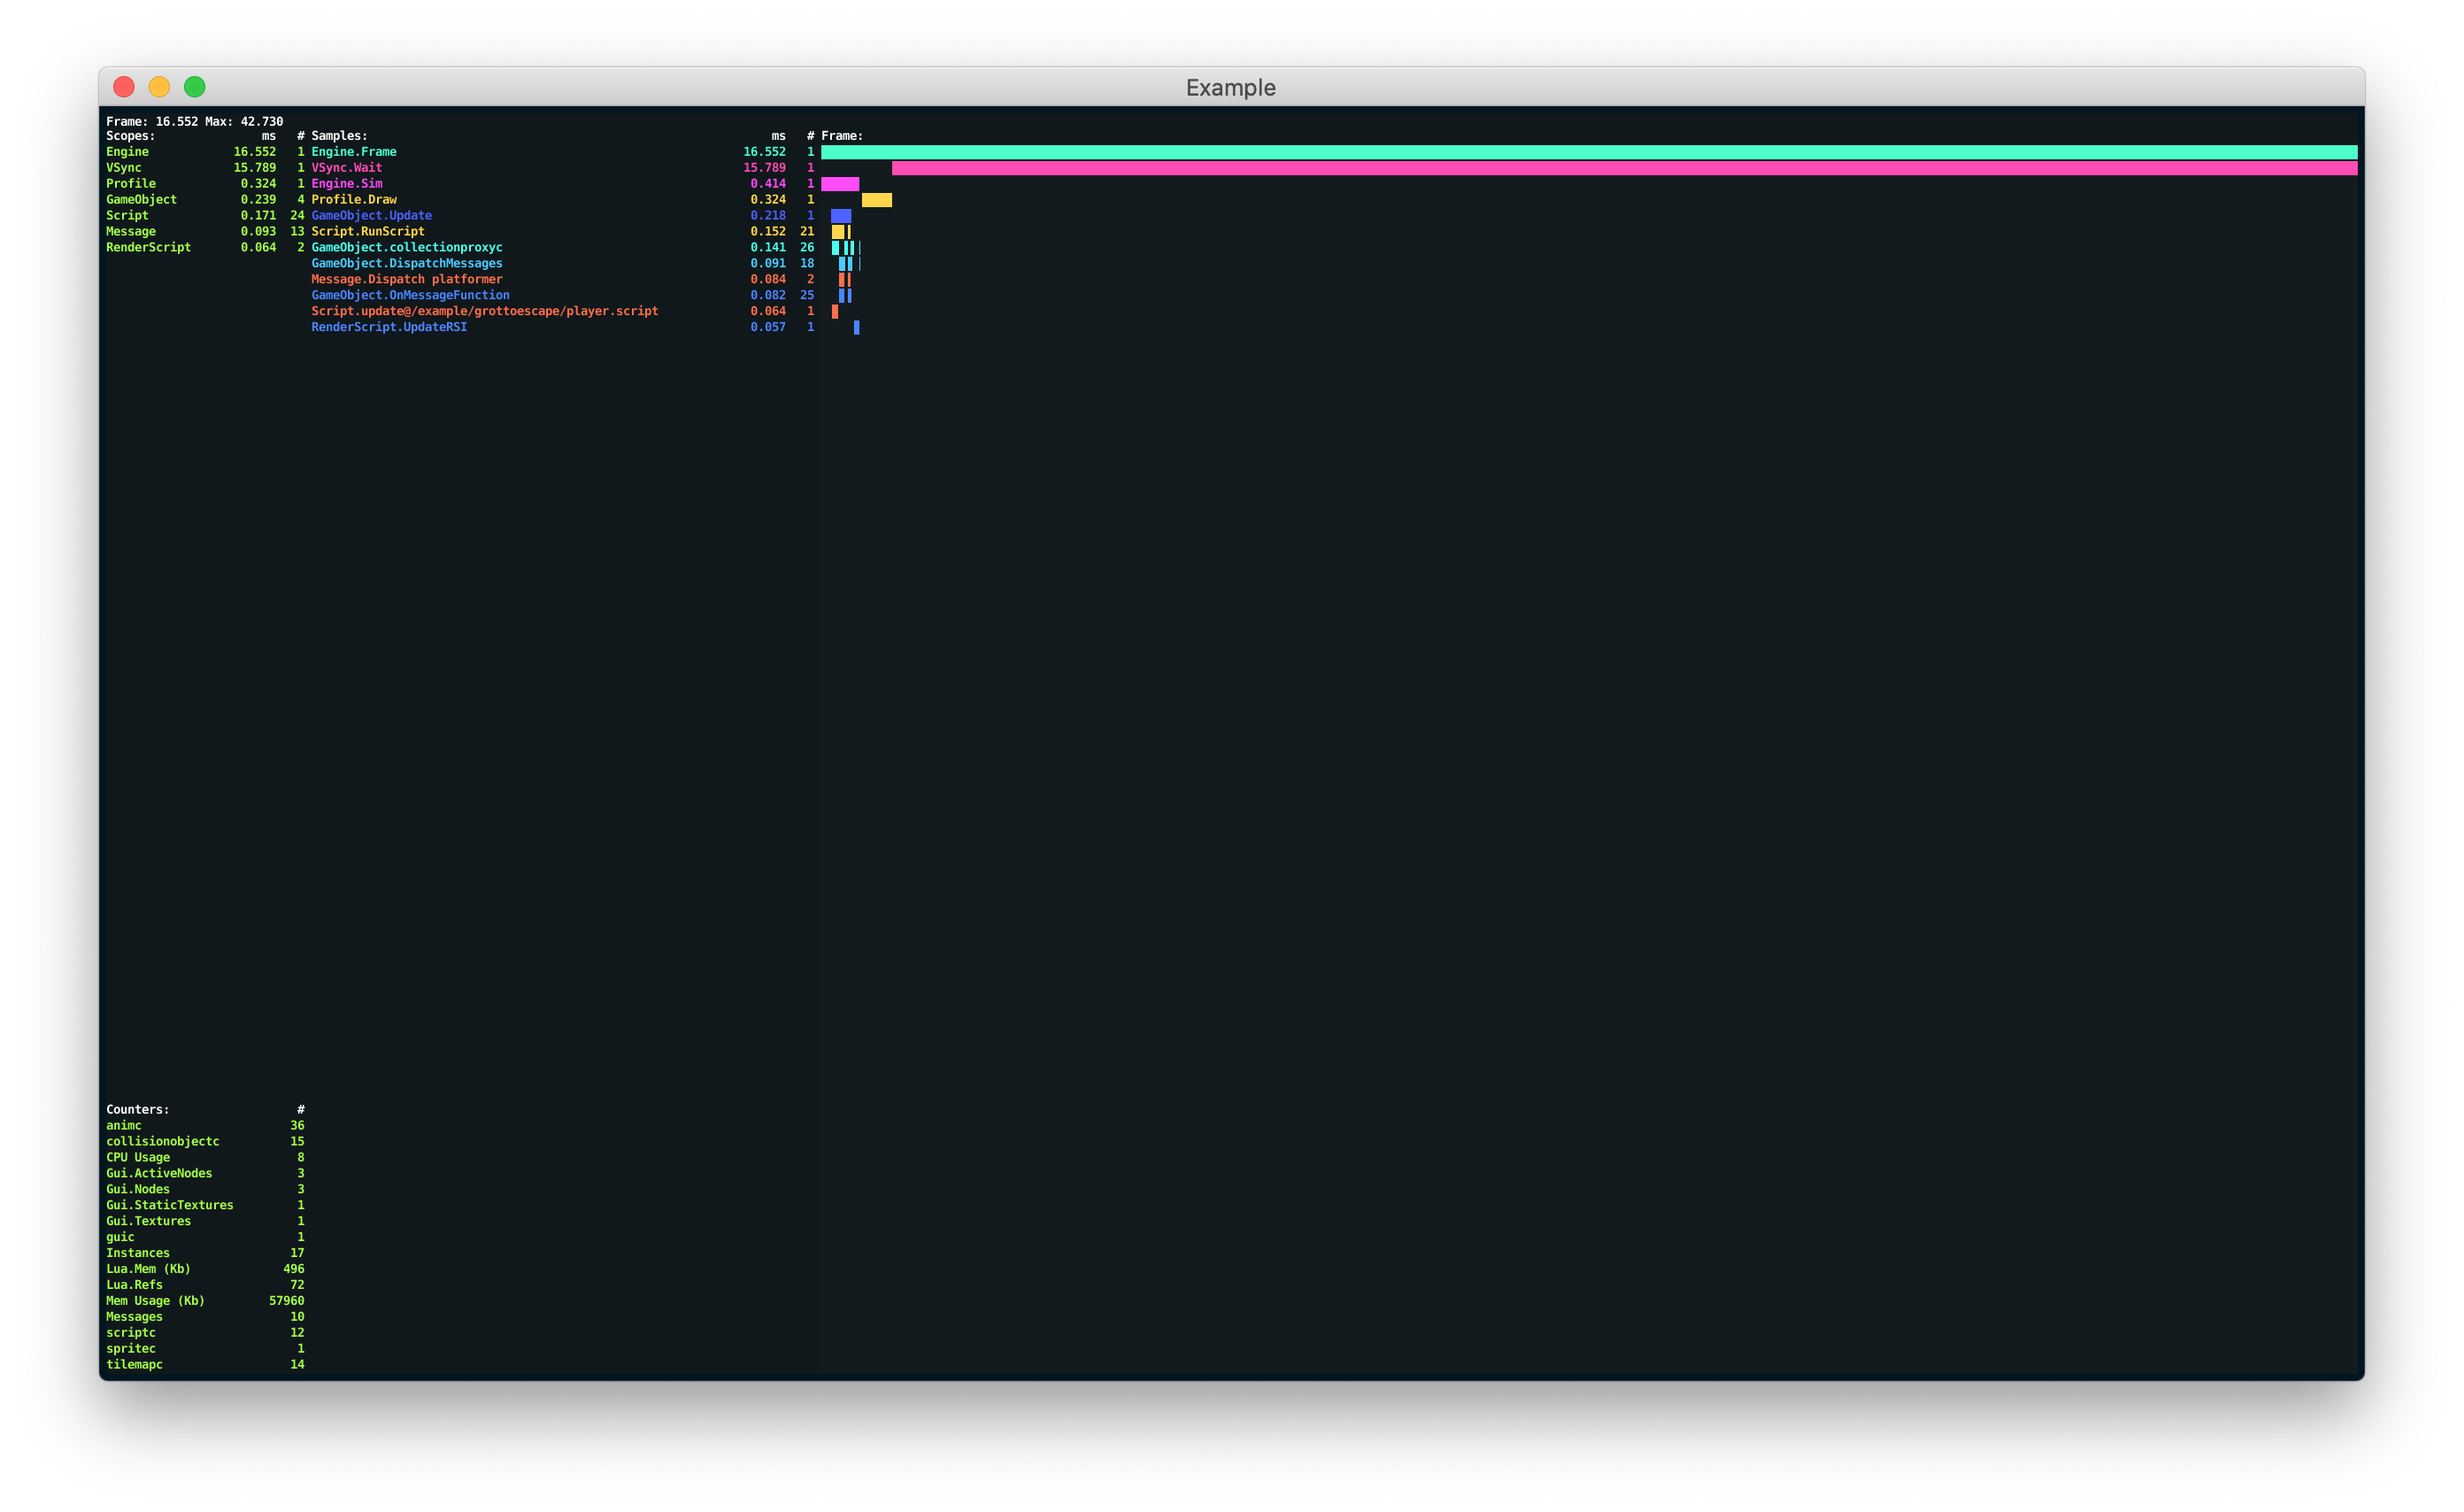
The visual profiler provides a number of different function that can be used to change the way the visual profiler presents its data:
profiler.set_ui_mode()
profiler.set_ui_view_mode()
profiler.view_recorded_frame()
Refer to a the profiler API reference for more information about the profiler functions.
The web profiler
While running a desktop or mobile build that includes profiler support, interactive frame and resource profilers can be accessed through a browser.
Remotery frame profiler
The Frame profiler allows you to sample your game while it is running and analyze individual frames in detail. To access the profiler:
- Start your game on your target device.
- Select Debug ▸ Open Web Profiler menu.
The frame profiler is divided into several sections that all give different views into the running game. Press the Pause button in the top right corner to temporarily stop the profiler from updating the views.
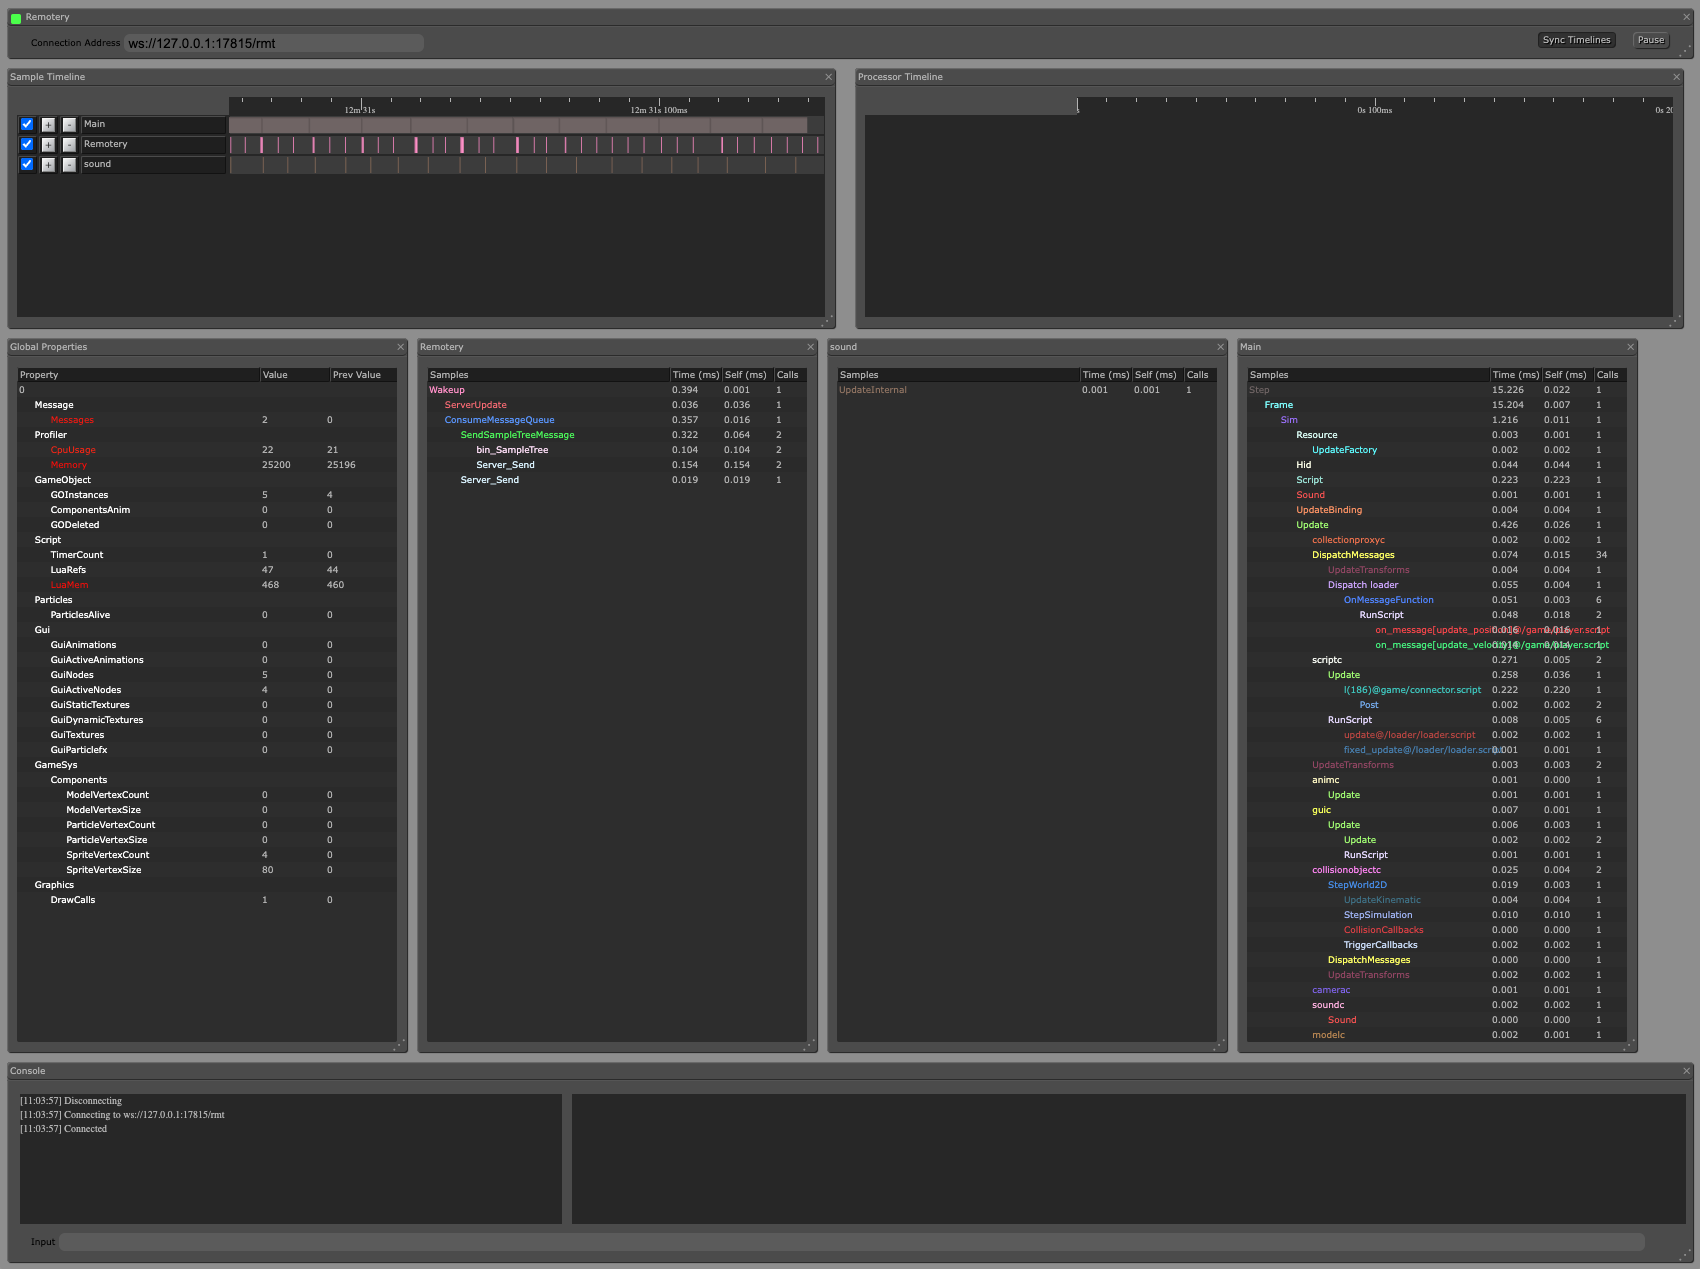
When you use multiple targets simultaneously, you can manually switch between them by changing the Connection Address field at the top of the page to match the Remotery profiler URL shown in the console when the target started:
INFO:ENGINE: Defold Engine 1.3.4 (80b1b73)
INFO:DLIB: Initialized Remotery (ws://127.0.0.1:17815/rmt)
INFO:ENGINE: Loading data from: build/default
- Sample Timeline
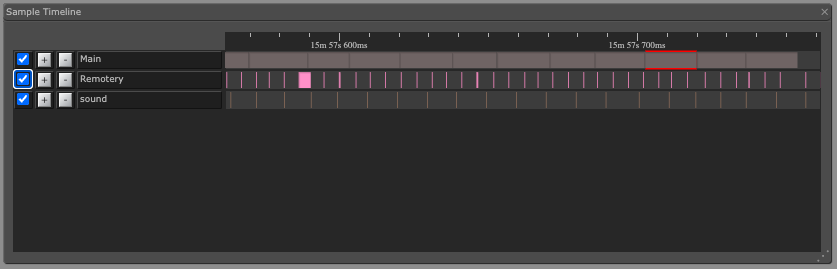
- The Sample Timeline will show the frames of data captured in the engine, one horizontal timeline per Thread. Main is the main thread where all of the game logic and most of the engine code is run. Remotery is for the profiler itself and Sound is for the sound mixing and playback thread. You can zoom in and out (using the mouse wheel) and select individual frames to see the details of a frame in the Frame Data view.
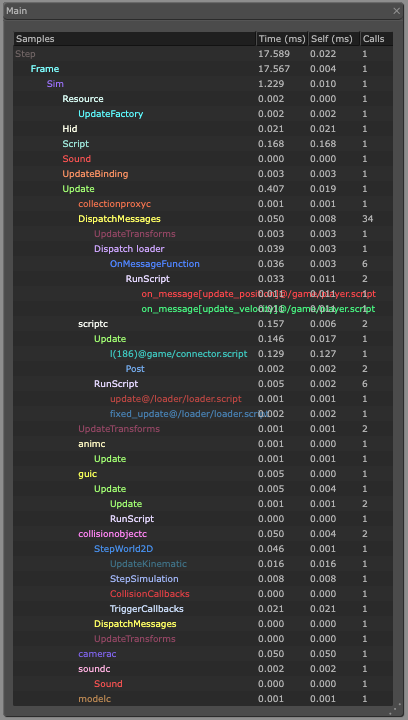
- Frame Data
- The Frame Data view is a table where all data for the currently selected frame is broken down into detail. You can view how many milliseconds are spent in each engine scope.
- Global Properties
- The Global Properties view shows a table of counters. They make it is easy to, for instance, track the number of draw calls or the number of components of a certain type.
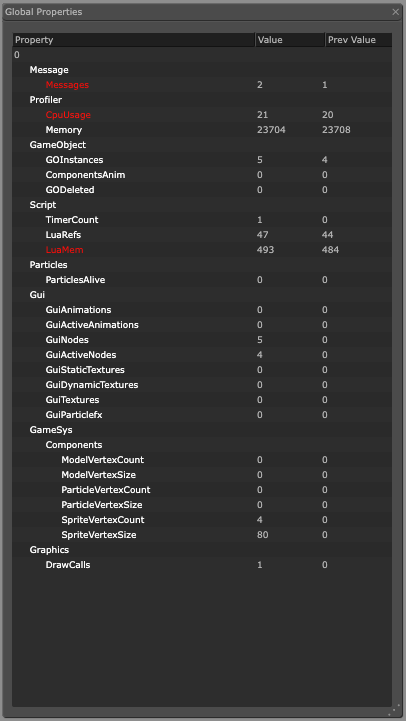
The LuaMem value is the amount of memory in kilobytes used by the Lua VM as reported by the Lua garbage collector. Memory is the amount of memory in kilobytes used by the engine.
The Max Sample Count setting limits the number of profiler samples recorded per thread per frame. If the profiler reports that the limit was exceeded, first check native-extension profiling code for an unmatched scope begin/end pair. Raise the cap only when a legitimate frame contains more scopes than the configured limit.
Resource profiler
The Resource profiler allows you to inspect your game while it is running and analyze resource use in detail. To access the profiler:
- Start your game on your target device.
- Open a browser and browse to http://localhost:8002
The resource profiler is divided into 2 sections, one showing a hierarchical view of the collections, game objects and components currently instantiated in your game, and the other showing all currently loaded resources.
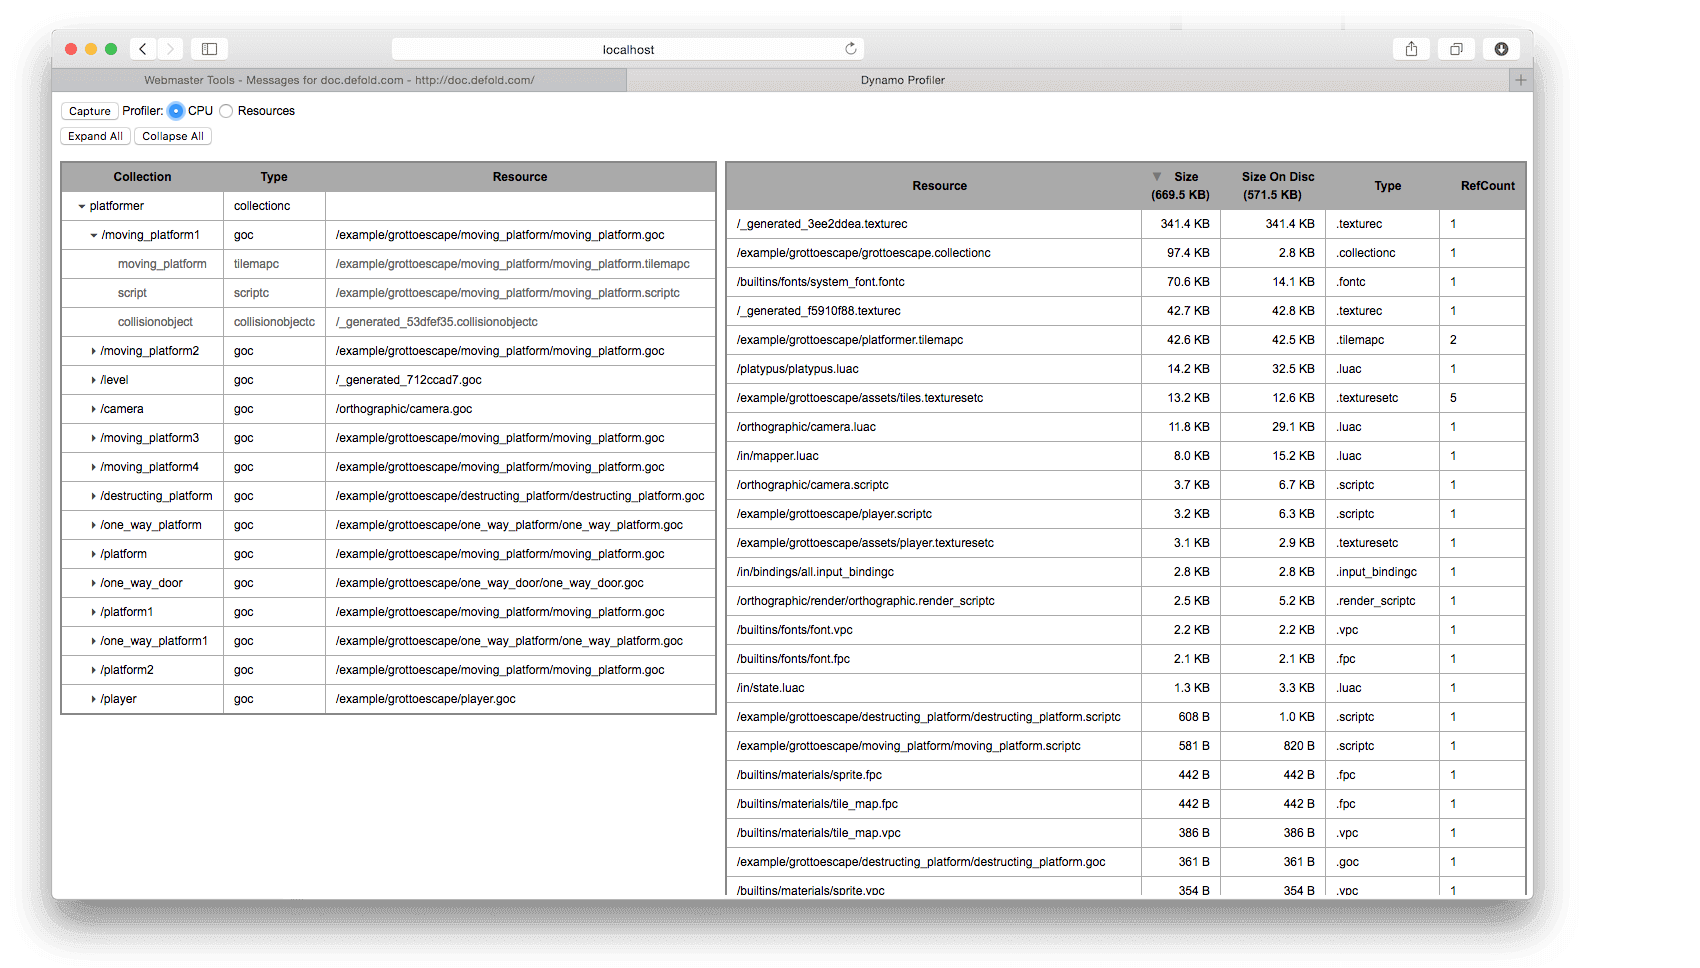
- Collection view
- The collection view shows hierarchical list of all game objects and components currently instantiated in the game and from which collection they originate. This is a very useful tool when you need to dig into and understand what you have instanced in your game at any given time and from where the objects originate.
- Resources view
- The resources view shows all resources currently loaded into memory, their size and the number of references to each resource. This is useful when optimizing memory usage in your application when you need to understand what is loaded into memory at any given time.
HTML5 browser performance timeline
HTML5 uses the Web Performance API instead of Remotery for its browser timeline. To record Defold scopes:
- Make sure the selected App Manifest profiler mode includes profiler support in the build variant you are running.
- Enable Performance Timeline Enabled (
profiler.performance_timeline_enabled) in game.project. - Launch the HTML5 build and open the browser developer tools.
- Record a session in the browser’s Performance panel and inspect the Defold scopes in the resulting timeline.
This browser timeline is separate from both the in-game visual profiler and the interactive Remotery web profiler.
Build reports
When bundling your game there is an option to create a build report. This is very useful to get a grip on the size of all the assets that are part of your game bundle. Simply check the Generate build report checkbox when bundling the game.
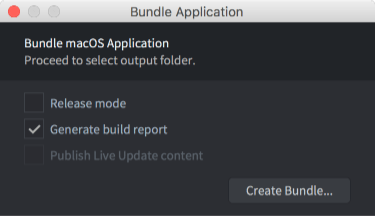
The builder will produce a file called report.html alongside the game bundle. Open the file in a web browser to inspect the report:
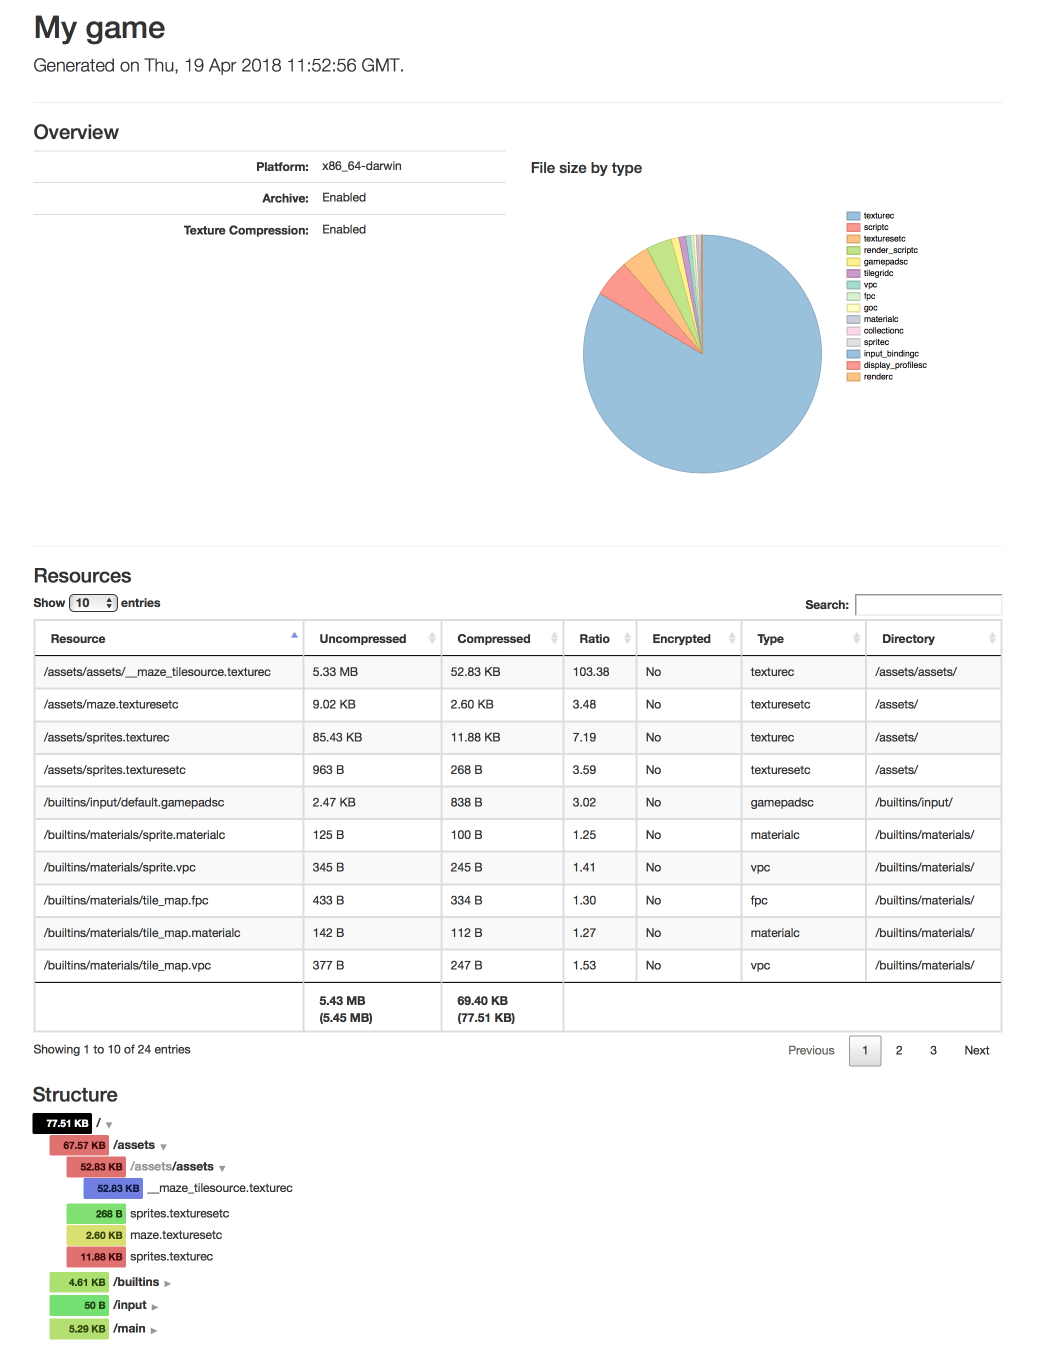
The Overview gives an over all visual breakdown of the project size based on resource type.
Resources shows a detailed list of resources that you can sort based on size, compression ratio, encryption, type and directory name. Use the “search” field to filter the resource entries displayed.
The Structure section shows sizes based on how resources are organized in the project file structure. Entries are color coded from green (light) to blue (heavy) according to the relative size of the file and directory content.
External tools
In addition to the built-in tools, there is a wide range of free high quality tracing and profiling tools available. Here is a selection:
- ProFi (Lua)
- We do not ship any built-in Lua profiler but there are external libraries that are easy enough to use. To find where your scripts spend time, either insert time measures in your code yourself, or use a Lua profiling library like ProFi.
Note that pure Lua profilers add quite a lot of overhead with each hook they install. For this reason you should be a bit wary of the timing profiles you get from such a tool. Counting profiles are accurate enough though.
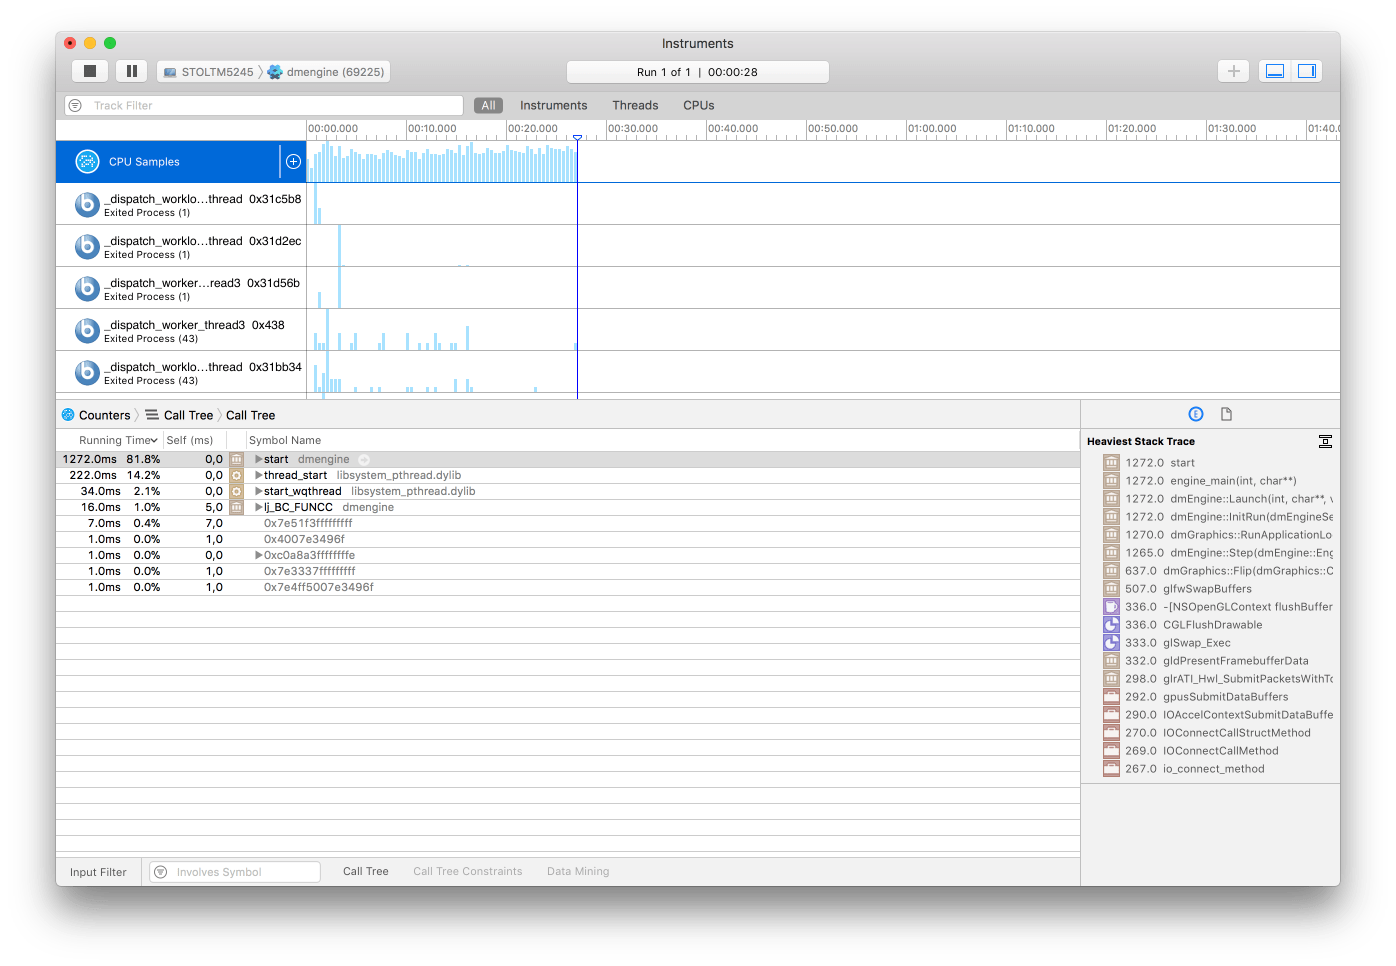
- Instruments (macOS and iOS)
- This is a performance analyzer and visualizer that is part of Xcode. It allows you to trace and inspect the behavior of one or more apps or processes, examine device specific features (like Wi-Fi and Bluetooth) and much more.
- OpenGL profiler (macOS)
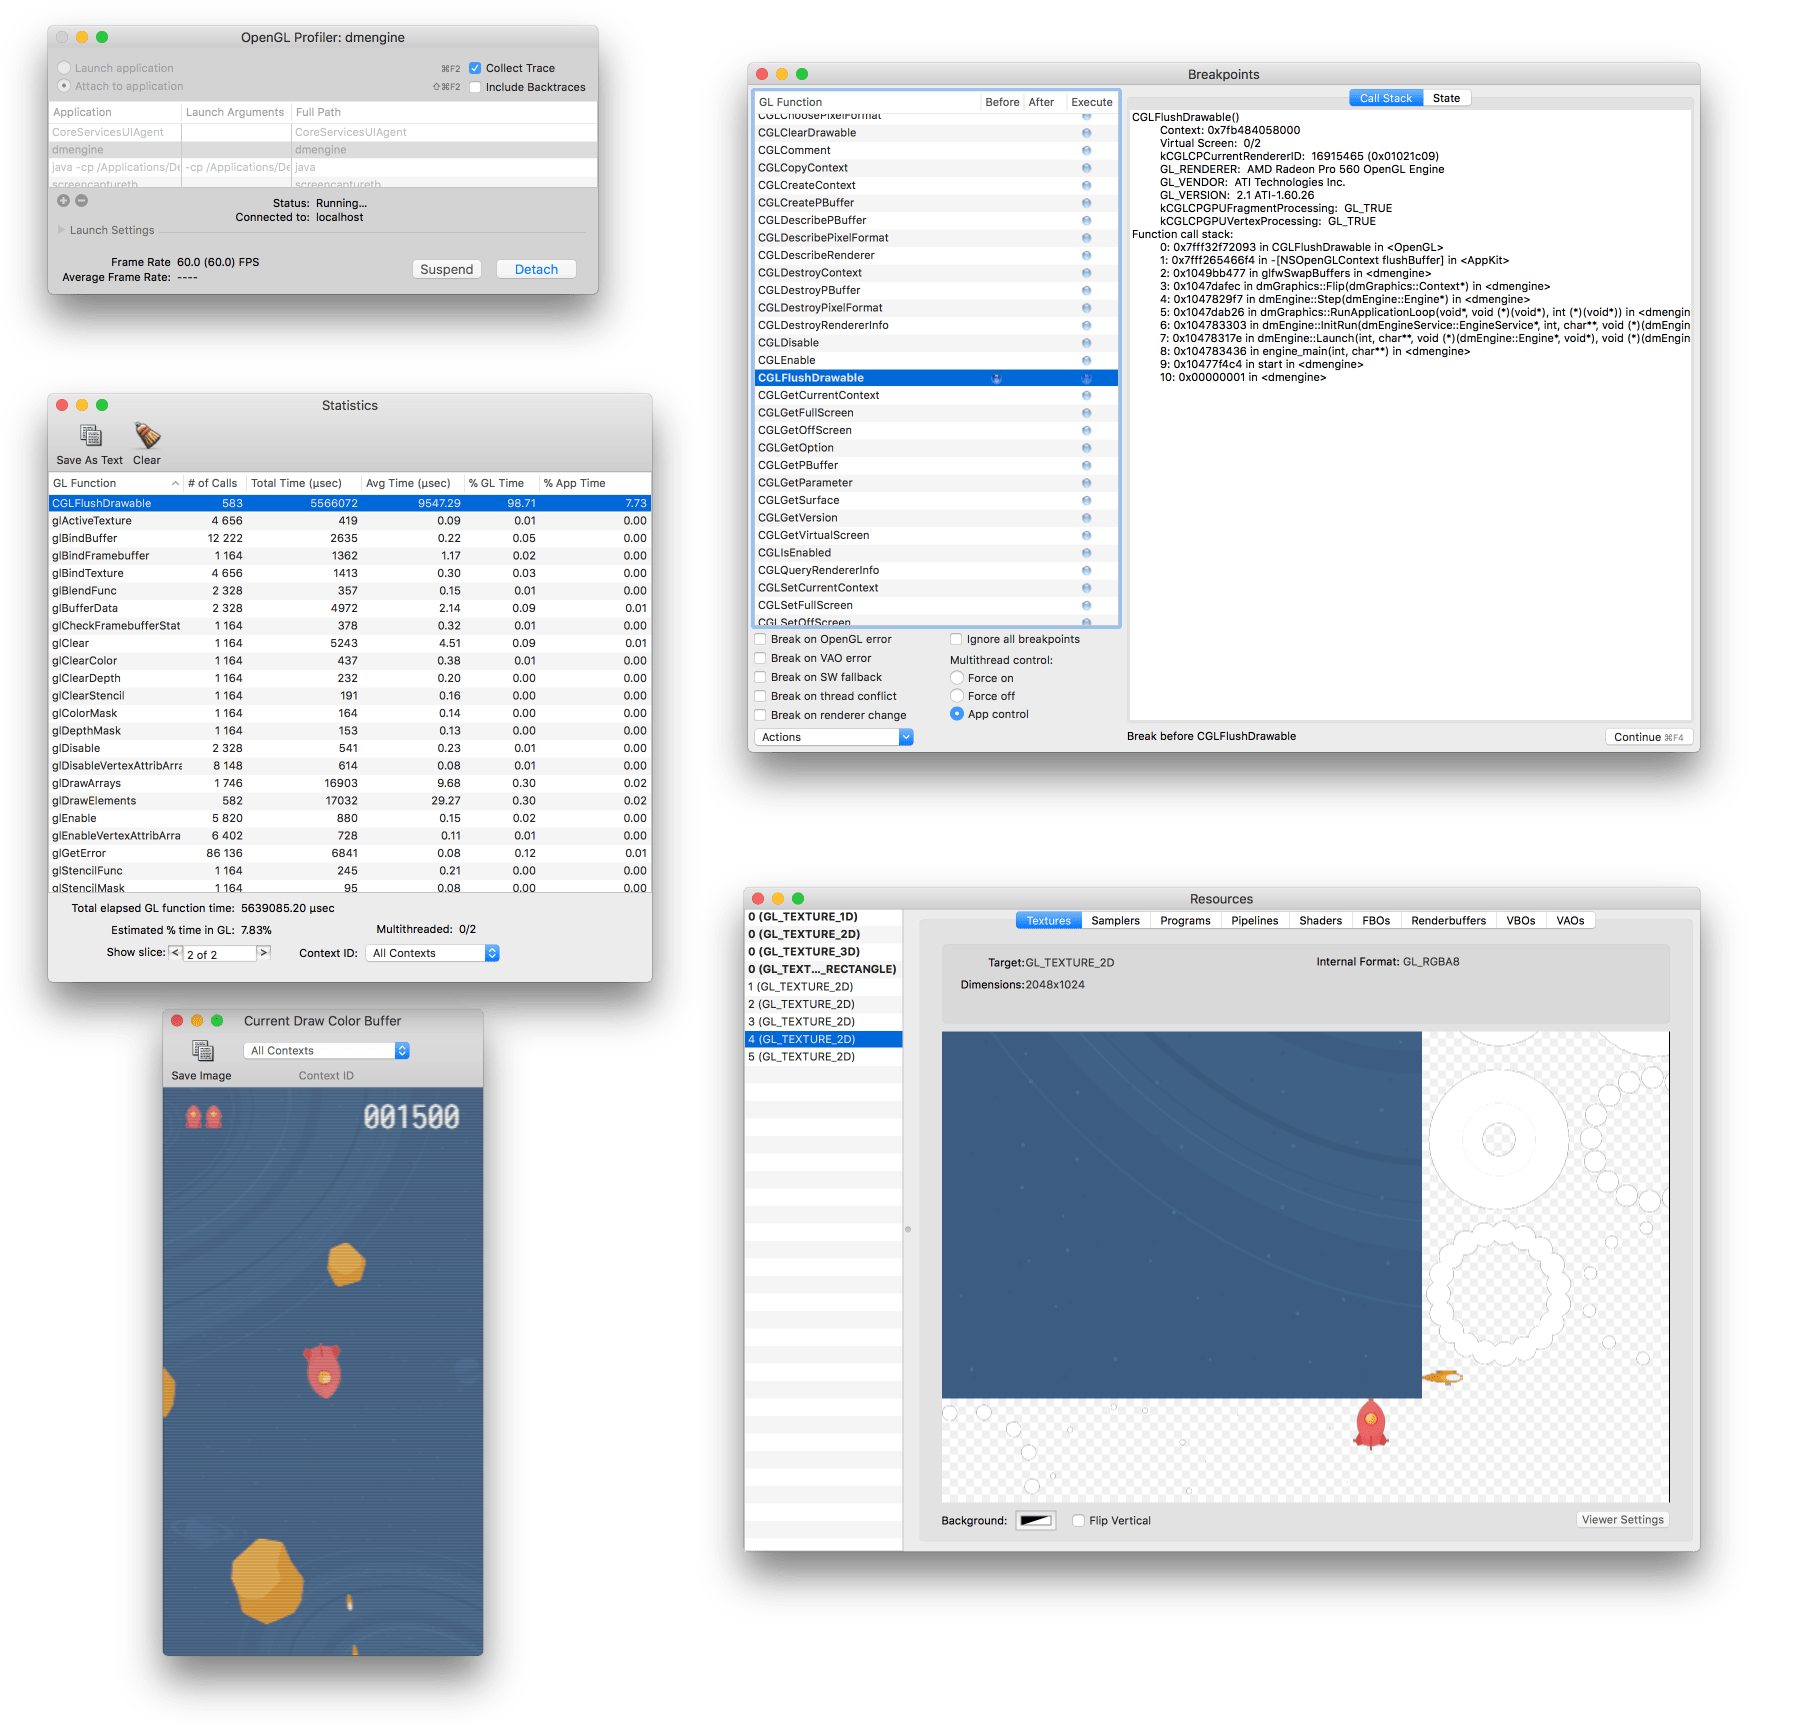
- Part of the package “Additional Tools for Xcode” that you can download from Apple (select Xcode ▸ Open Developer Tool ▸ More Developer Tools... in the Xcode menu).
This tool allows you to inspect a running Defold application and see how it uses OpenGL. It allows you to do traces of OpenGL function calls, set breakpoints on OpenGL functions, investigate application resources (textures, programs, shaders etc), look at buffer contents, and check other aspects of the OpenGL state.
- Android Profiler (Android)
- https://developer.android.com/studio/profile/android-profiler.html
A set of profiling tools that captures real-time data of your game’s CPU, memory, and network activity. You can perform sample-based method tracing of code execution, capture heap dumps, view memory allocations, and inspect the details of network-transmitted files. Using the tool requires that you set
android:debuggable="true"inAndroidManifest.xml.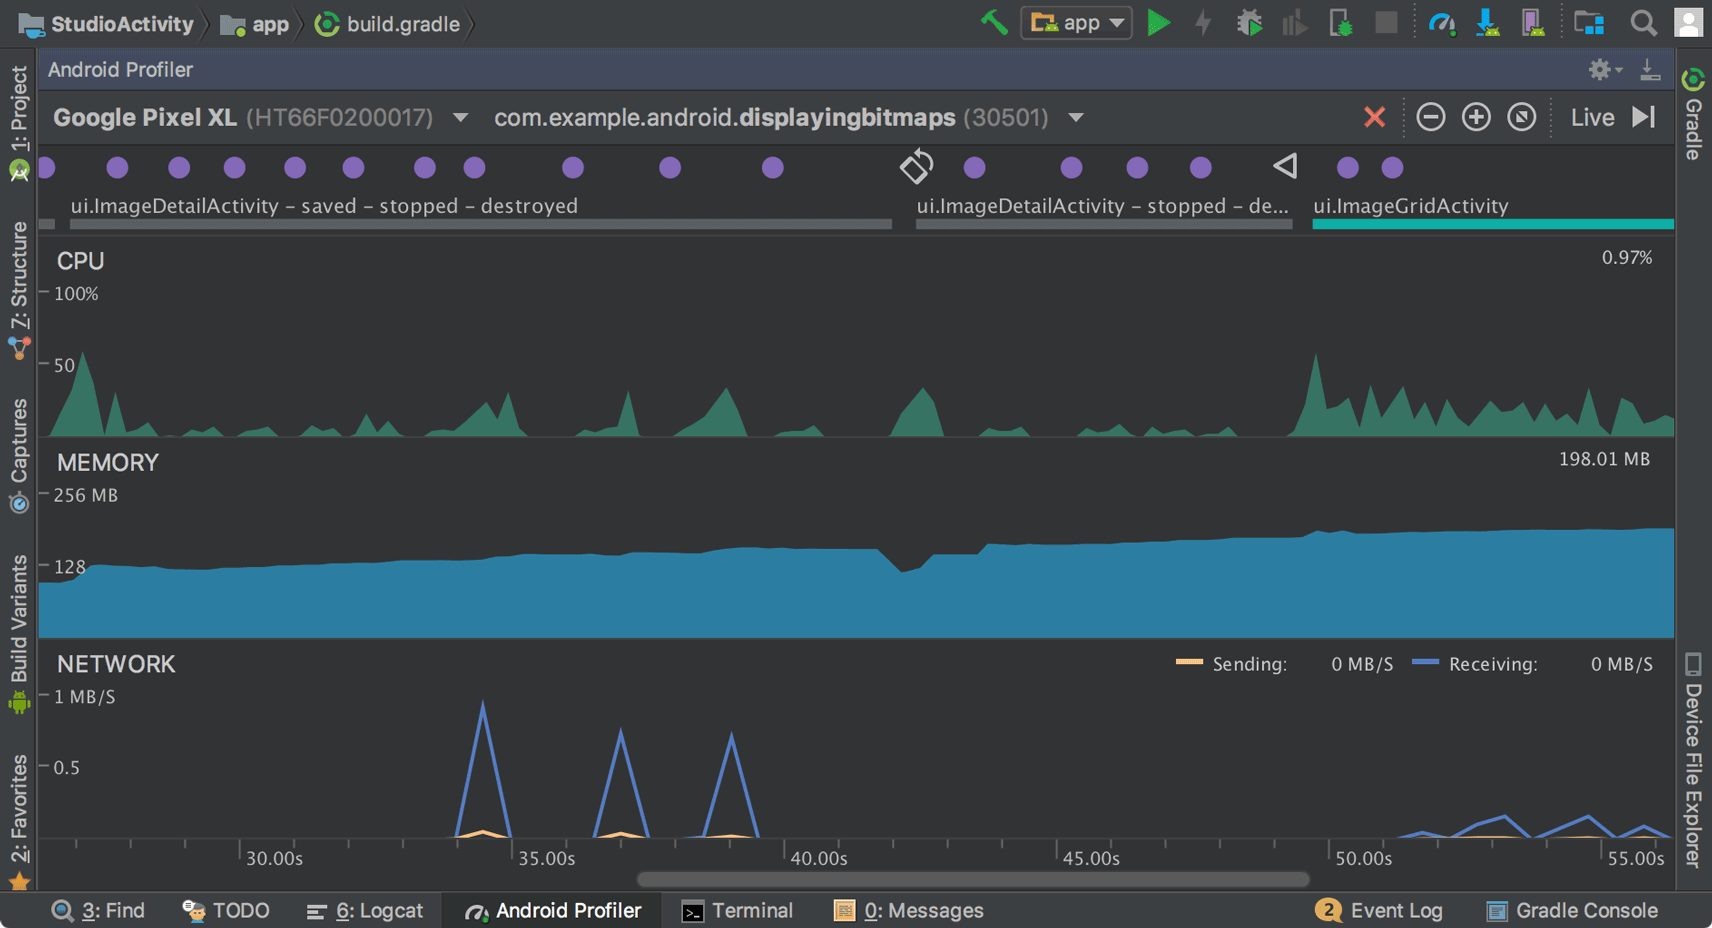
Note: Since Android Studio 4.1 it is also possible to run the profiling tools without starting Android Studio.
- Graphics API Debugger (Android)
- https://github.com/google/gapid
This is a collection of tools that allows you to inspect, tweak and replay calls from an application to a graphics driver. To use the tool requires that you set
android:debuggable="true"inAndroidManifest.xml.